- Популярные видео
- Авто
- Видео-блоги
- ДТП, аварии
- Для маленьких
- Еда, напитки
- Животные
- Закон и право
- Знаменитости
- Игры
- Искусство
- Комедии
- Красота, мода
- Кулинария, рецепты
- Люди
- Мото
- Музыка
- Мультфильмы
- Наука, технологии
- Новости
- Образование
- Политика
- Праздники
- Приколы
- Природа
- Происшествия
- Путешествия
- Развлечения
- Ржач
- Семья
- Сериалы
- Спорт
- Стиль жизни
- ТВ передачи
- Танцы
- Технологии
- Товары
- Ужасы
- Фильмы
- Шоу-бизнес
- Юмор
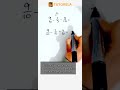
Identify Negative Domains in a Function Graph! #Math #Functions
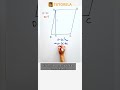
In this video, we explore how to determine when a function takes on negative values within the domain from -0.5 to 2. By examining function graphs, you'll learn the skills needed to identify areas where Y-values are less than zero.
- Discover the concept of negative domains within functions.
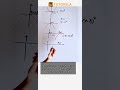
- Learn how to identify when a function dips below the X-axis.
- Understand the implications of a function's decreasing trend.
- Engage with visual demonstrations to enhance comprehension.
This session provides critical insights into graph reading and mathematical analysis, a vital skill in calculus and beyond. By the end of this video, you'll have a clearer understanding of how functions behave and what it means when they're negative.
Enjoyed the video? Give us a thumbs up, subscribe for more mathematical content, and share your thoughts in the comments below!
Visit us at [tutorela.com](https://www.tutorela.com)
Find us on the app stores:
- Apple: [Math Games App - Tutorela](https://apps.apple.com/us/app/math-games-app-tutorela/id6449216490)
- Google: [Math Games App - Tutorela](https://play.google.com/store/apps/details?id=com.tutorela.www)
#MathEducation #FunctionAnalysis #GraphReading #IncreasingAndDecreasingIntervalsOfAFunction
Видео Identify Negative Domains in a Function Graph! #Math #Functions канала Tutorela Math
- Discover the concept of negative domains within functions.
- Learn how to identify when a function dips below the X-axis.
- Understand the implications of a function's decreasing trend.
- Engage with visual demonstrations to enhance comprehension.
This session provides critical insights into graph reading and mathematical analysis, a vital skill in calculus and beyond. By the end of this video, you'll have a clearer understanding of how functions behave and what it means when they're negative.
Enjoyed the video? Give us a thumbs up, subscribe for more mathematical content, and share your thoughts in the comments below!
Visit us at [tutorela.com](https://www.tutorela.com)
Find us on the app stores:
- Apple: [Math Games App - Tutorela](https://apps.apple.com/us/app/math-games-app-tutorela/id6449216490)
- Google: [Math Games App - Tutorela](https://play.google.com/store/apps/details?id=com.tutorela.www)
#MathEducation #FunctionAnalysis #GraphReading #IncreasingAndDecreasingIntervalsOfAFunction
Видео Identify Negative Domains in a Function Graph! #Math #Functions канала Tutorela Math
Комментарии отсутствуют
Информация о видео
7 июня 2026 г. 23:41:14
00:00:44
Другие видео канала