- Популярные видео
- Авто
- Видео-блоги
- ДТП, аварии
- Для маленьких
- Еда, напитки
- Животные
- Закон и право
- Знаменитости
- Игры
- Искусство
- Комедии
- Красота, мода
- Кулинария, рецепты
- Люди
- Мото
- Музыка
- Мультфильмы
- Наука, технологии
- Новости
- Образование
- Политика
- Праздники
- Приколы
- Природа
- Происшествия
- Путешествия
- Развлечения
- Ржач
- Семья
- Сериалы
- Спорт
- Стиль жизни
- ТВ передачи
- Танцы
- Технологии
- Товары
- Ужасы
- Фильмы
- Шоу-бизнес
- Юмор
How to Manually Group Data in Tableau – A Quick Guide
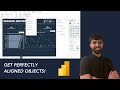
🎯 How to Manually Group Data in Tableau – A Quick Guide
Need to clean up messy data or create clearer categories in your Tableau dashboards? In this video, Sport Horizon’s Jay Binning shows you how to manually group data to make your reports more organised, readable, and impactful.
📌 You’ll learn how to:
- Combine similar or inconsistent values into custom groups
- Create cleaner visualisations with simplified labels
- Build new categorical fields to enhance clarity
- Improve how your audience interprets the data
This is a must-know feature for anyone working in sports analytics, business intelligence, or any field where clean and consistent visuals make a difference.
🧠 Perfect for sport scientists, performance analysts, or anyone looking to get more control over their Tableau visualisations.
✅ Easy to follow, quick to implement, and immediately useful.
⸻
🎥 WATCH NEXT
🔹 📺 How to Move Data Labels in Tableau for Clearer Visuals
🔹 📺 Creating a Clean Power BI Dashboard from Raw Football Data
🔹 📺 How to Use Conditional Formatting in Power BI
⸻
Want to understand athlete monitoring and training load fundamentals, alongside learning how to build out bespoke training load and response dashboards and reports in Power BI?
Our new course with Jo Clubb from Global Performance Insights, Fundamentals of Load Monitoring, has gone live!
👉 Visit our landing page below to get access:
https://www.sporthorizon.co.uk/fundamentals-of-load-monitoring
🔗 And to learn more about the course and its applied benefits, check out this great introduction video featuring Ciaran Deely from Sport Horizon and Jo Clubb from Global Performance Insights.
They explore load monitoring, applied practice frameworks, and why learning Power BI is so valuable for practitioners:
👉 https://www.youtube.com/watch?v=XYbKghPWqAI
⸻
🔔 SUBSCRIBE
Join our community and never miss a video – subscribe here:
👉 https://www.youtube.com/@SportHorizonUK?sub_confirmation=1
⸻
☕ SUPPORT US
Found our content useful? You can now support our work:
👉 https://buymeacoffee.com/sporthorizon
⸻
👨🏫 ABOUT
At Sport Horizon, we support analysts, sport scientists, and coaches with tailored education in sports data analysis. Our team combines real-world experience in elite sport with expertise in tools like Power BI, Tableau, and Excel. Whether you’re working in football, GAA, rugby, or another team sport, we help you bridge the gap between data and performance.
⸻
🔗 CONNECT
• Website: https://www.sporthorizon.co.uk
• LinkedIn: https://www.linkedin.com/company/sport-horizon-uk/
• X: https://x.com/SportHorizonUK
• 📧 For business inquiries: info@sporthorizon.co.uk
Видео How to Manually Group Data in Tableau – A Quick Guide канала Sport Horizon
Комментарии отсутствуют
Информация о видео
3 июля 2025 г. 18:45:45
00:02:28
Другие видео канала