- Популярные видео
- Авто
- Видео-блоги
- ДТП, аварии
- Для маленьких
- Еда, напитки
- Животные
- Закон и право
- Знаменитости
- Игры
- Искусство
- Комедии
- Красота, мода
- Кулинария, рецепты
- Люди
- Мото
- Музыка
- Мультфильмы
- Наука, технологии
- Новости
- Образование
- Политика
- Праздники
- Приколы
- Природа
- Происшествия
- Путешествия
- Развлечения
- Ржач
- Семья
- Сериалы
- Спорт
- Стиль жизни
- ТВ передачи
- Танцы
- Технологии
- Товары
- Ужасы
- Фильмы
- Шоу-бизнес
- Юмор
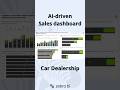
From Static Numbers to Story-Driven KPIs in Power BI (+ Free PBIX) | 3 of 12 Days to Clarity
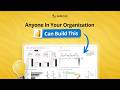
📊 Learn how to design meaningful Power BI KPI cards with Zebra BI Cards. Combine actual, plan and previous year in a single visual, show automatic variances, and turn your sales, cost and marketing dashboards into compact, decision ready KPI overviews.
Unwrap your Day 3 gift. Visit 👉 https://bit.ly/4s0hlKy
to grab the free Power BI template (PBIX) and explore all 12 Days to Clarity resources.
🤖 New to Power BI or want a faster start with AI? Watch our beginner guide to Power BI with ChatGPT next: https://youtu.be/CFoi1Ieb3T0
💡 Simplify your reporting with IBCS-compliant, automated visuals. Download Zebra BI for Power BI today and build clear, actionable dashboards in minutes — no coding, no complexity. Start here: https://bit.ly/4iIYzDf
⚡🚀⏱️Meet Zebra AI, your AI-powered data assistant. Clean and prepare messy Excel or CSV files instantly, generate insights automatically, and let the visuals do the heavy lifting — from dynamic comments to responsive layouts. Try it now: https://bit.ly/4iGFCRm
---------------------------------------------------------------------------------------------------------------------------------------------------------------
▶EDUCATION:
Join Zebra BI Academy for free Power BI course: https://bit.ly/4iMAQC6
---------------------------------------------------------------------------------------------------------------------------------------------------------------
▶RESOURCES 💵📊📈📉💡
Explore all 12 Days to Clarity resources: https://bit.ly/4s0hlKy
Free Webinars: https://zebrabi.com/resources/?_resource_type=webinar#filters
Guide: Optimize Power BI report performance: https://zebrabi.com/power-bi-performance-optimization/
Case Study – Helvetia: https://zebrabi.com/customer_stories/helvetia/
Knowledge Base: https://help.zebrabi.com/kb/power-bi/data-modeling/
---------------------------------------------------------------------------------------------------------------------------------------------------------------
Chapters:
00:00 Day 3: Why KPI cards matter on every Power BI dashboard
00:30 Native Power BI Card visual: just a single number
01:05 New Card in Power BI: categories and reference labels
02:05 Native KPI visual: trend, targets and confusing colors
03:15 Switching to Zebra BI Cards: mapping Actual and Plan
04:00 Tooltips, small charts and automatic variances in one card
04:45 Multiple KPIs in one visual with smart color logic
05:30 Formatting KPIs: percentages, inverting costs and fine tuning
06:10 Minimalist KPI strip: suppressing charts, keeping density
06:40 Adding Previous Year and switching variance views
07:15 Recap, use cases beyond sales and CTA for Zebra BI trial
---------------------------------------------------------------------------------------------------------------------------------------------------------------
▶More Content 🍿🎥📺🎞️🎬
The BEST Power BI Dashboards You’ll LOVE in 2025 (Proven Framework): https://youtu.be/XmaEyD2poQE
Zebra BI Webinars Playlist: https://www.youtube.com/playlist?list=PLBTvRNTcMStU-sv2I2vKog3RgUvrxQKB1
Zebra BI Channel: https://www.youtube.com/@ZebraBI
---------------------------------------------------------------------------------------------------------------------------------------------------------------
▶EXTRA
Follow us on socials: Twitter: https://twitter.com/zebrabi | Facebook: https://www.facebook.com/zebra.bi/ | LinkedIn: https://www.linkedin.com/company/5051039
Website: https://www.zebrabi.com/
Want a live demo of Zebra BI? Sign up: https://zebrabi.com/live-demo
---------------------------------------------------------------------------------------------------------------------------------------------------------------
▶Business inquiries: info@zebrabi.com
#PowerBI #kpi #ZebraBI
Видео From Static Numbers to Story-Driven KPIs in Power BI (+ Free PBIX) | 3 of 12 Days to Clarity канала Zebra BI
#PowerBI #ZebraBI #KPIcards #FinancialReporting #DataVisualization #BusinessIntelligence #SalesDashboards #PerformanceMetrics #KPIvisualization #FinancialInsights #DataClarity #PowerBIDashboards #Forecasting #DynamicReports #BusinessReporting #DecisionMaking #FinancialAnalysis #PowerBIDashboardsDesign #CostManagement #DataDriven #DataExploration
Комментарии отсутствуют
Информация о видео
10 декабря 2025 г. 15:15:02
00:09:01
Другие видео канала