- Популярные видео
- Авто
- Видео-блоги
- ДТП, аварии
- Для маленьких
- Еда, напитки
- Животные
- Закон и право
- Знаменитости
- Игры
- Искусство
- Комедии
- Красота, мода
- Кулинария, рецепты
- Люди
- Мото
- Музыка
- Мультфильмы
- Наука, технологии
- Новости
- Образование
- Политика
- Праздники
- Приколы
- Природа
- Происшествия
- Путешествия
- Развлечения
- Ржач
- Семья
- Сериалы
- Спорт
- Стиль жизни
- ТВ передачи
- Танцы
- Технологии
- Товары
- Ужасы
- Фильмы
- Шоу-бизнес
- Юмор
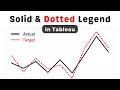
Custom Shape Waffle Chart with Dynamic Legends and Metrics in Tableau
Learn how to create a basic waffle chart with custom shapes in Tableau and pair it with a legend that matches those shapes. The legend reinforces the meaning behind the waffle chart by displaying category values and related metrics.
To build the legend, I use two SUM(0) fields in the Columns shelf to create two marks.
1. First Mark: Change the mark type to Shape and select the same custom shape used in the waffle chart (e.g., rounded containers, stars, or icons).
2. Second Mark: Change the mark type to Text, then add the status category value (e.g., Complete, Pending, Cancelled) along with relevant metrics like the total number of orders and the percentage of orders represented in the waffle chart.
This method creates a clear, intuitive legend that helps users easily understand the waffle chart. The custom shapes in the legend visually match the chart, while the additional metrics provide context and detail, improving the overall clarity and effectiveness of your dashboard.
Tableau: https://public.tableau.com/app/profile/samantha.cohn/viz/BeyondBasicChartsModernOrdersTab/Orders
Tableau: https://public.tableau.com/app/profile/samantha.cohn/viz/BeyondBasicChartsModernOrdersTab/Orders
Excel: https://docs.google.com/spreadsheets/d/1LD5zIeEx9Lvv-37tSYeUAub-9ahESLiHSMW4u2QwbtQ/edit?usp=sharing
Formulas: https://docs.google.com/document/d/1bXlz1Z05J_rhS1LVXvaAe4l4yODTlkmy6oK4ln394yI/edit?usp=sharing
Rounded Corner Box: https://drive.google.com/file/d/14gm7FmNqanJmiGFKAy4r7ly-WKhV6uxL/view?usp=sharing
Видео Custom Shape Waffle Chart with Dynamic Legends and Metrics in Tableau канала Golden Insights
Комментарии отсутствуют
Информация о видео
14 февраля 2025 г. 19:55:00
00:10:09
Другие видео канала