- Популярные видео
- Авто
- Видео-блоги
- ДТП, аварии
- Для маленьких
- Еда, напитки
- Животные
- Закон и право
- Знаменитости
- Игры
- Искусство
- Комедии
- Красота, мода
- Кулинария, рецепты
- Люди
- Мото
- Музыка
- Мультфильмы
- Наука, технологии
- Новости
- Образование
- Политика
- Праздники
- Приколы
- Природа
- Происшествия
- Путешествия
- Развлечения
- Ржач
- Семья
- Сериалы
- Спорт
- Стиль жизни
- ТВ передачи
- Танцы
- Технологии
- Товары
- Ужасы
- Фильмы
- Шоу-бизнес
- Юмор
From line to powers to roots | Power Curve Visualized #manim #maths #geometry #mathematics
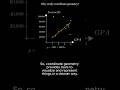
How do the graphs of y = xⁿ and y = x^(1/n) change as n goes from 1 to 20?
🔹 Powers get steeper and sharper
🔹 Roots get smoother and closer to y = x
🔹 Beautiful symmetry as the curves evolve
This short animation shows both — side by side — from squares to 20th powers and 20th roots.
Created using Python + Manim.
Part of the History of Curves series.
🔔 Subscribe for more bite-sized math visuals!
#math #manim #graph #visualization #functions #shorts
Видео From line to powers to roots | Power Curve Visualized #manim #maths #geometry #mathematics канала MonkeyFace
Комментарии отсутствуют
Информация о видео
29 июля 2025 г. 17:45:01
00:00:15
Другие видео канала