- Популярные видео
- Авто
- Видео-блоги
- ДТП, аварии
- Для маленьких
- Еда, напитки
- Животные
- Закон и право
- Знаменитости
- Игры
- Искусство
- Комедии
- Красота, мода
- Кулинария, рецепты
- Люди
- Мото
- Музыка
- Мультфильмы
- Наука, технологии
- Новости
- Образование
- Политика
- Праздники
- Приколы
- Природа
- Происшествия
- Путешествия
- Развлечения
- Ржач
- Семья
- Сериалы
- Спорт
- Стиль жизни
- ТВ передачи
- Танцы
- Технологии
- Товары
- Ужасы
- Фильмы
- Шоу-бизнес
- Юмор
Phoenix Dashboard Training Series: Option Chain- Core Concepts
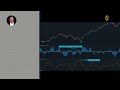
In this video, we dive deeper into the levels revealed by the Option Chain — the zones where institutional call and put activity defines structure, controls momentum, and drives intraday movement.
You’ll learn how bullish and bearish trends are formed, how tops and bottoms develop through institutional positioning, and how to recognize when markets shift from trending to choppy conditions.
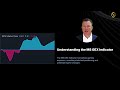
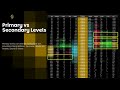
We’ll break down primary vs. secondary levels, how to confirm level strength using color intensity, and how to interpret the GEX Trend Strength (GTS) indicator to determine whether a level is likely to hold or fail.
These levels aren’t theoretical — they’re the result of live institutional activity and dealer hedging behavior. Understanding them gives 0 DTE traders the ability to anticipate price reactions, identify high-probability entries, and trade with precision around real liquidity.
This video builds on the introduction to the Option Chain and sets the stage for the next part of the series, where we’ll analyze live examples of how these levels form, strengthen, and break throughout the trading session.
🎥 Watch the full Phoenix Dashboard Training Series:
https://www.youtube.com/playlist?list=PL13x2Gm2ecpw_voK14gA2hrZa6l2-Uejb
💡 Join the SPX Gamma Discord Community:
https://discord.com/invite/vXffvvWNXy
🌐 Learn more at:
https://www.spxgamma.com
Видео Phoenix Dashboard Training Series: Option Chain- Core Concepts канала SPX Gamma
You’ll learn how bullish and bearish trends are formed, how tops and bottoms develop through institutional positioning, and how to recognize when markets shift from trending to choppy conditions.
We’ll break down primary vs. secondary levels, how to confirm level strength using color intensity, and how to interpret the GEX Trend Strength (GTS) indicator to determine whether a level is likely to hold or fail.
These levels aren’t theoretical — they’re the result of live institutional activity and dealer hedging behavior. Understanding them gives 0 DTE traders the ability to anticipate price reactions, identify high-probability entries, and trade with precision around real liquidity.
This video builds on the introduction to the Option Chain and sets the stage for the next part of the series, where we’ll analyze live examples of how these levels form, strengthen, and break throughout the trading session.
🎥 Watch the full Phoenix Dashboard Training Series:
https://www.youtube.com/playlist?list=PL13x2Gm2ecpw_voK14gA2hrZa6l2-Uejb
💡 Join the SPX Gamma Discord Community:
https://discord.com/invite/vXffvvWNXy
🌐 Learn more at:
https://www.spxgamma.com
Видео Phoenix Dashboard Training Series: Option Chain- Core Concepts канала SPX Gamma
Комментарии отсутствуют
Информация о видео
15 октября 2025 г. 7:47:13
00:04:36
Другие видео канала