Supertrend Indicator Tested 100 Times so you don't have to... - Forex Day Trading
Super Trend Trading Strategy Indicator tested to find the real win-rate and learn how to use the Supertrend Indicator properly in day trading and swing trading.
Official Trading Rush Website: https://tradingrush.net
Download Official Trading Rush APP (Thanks): https://bit.ly/tradingrushapp
Support the Channel on Patreon (Thanks): https://www.patreon.com/tradingrush
Trading Merch for Best Traders: https://teespring.com/stores/trading-rush
Watch More Videos:
MACD Trading Strategy tested 100 times : https://youtu.be/nmffSjdZbWQ
Trading Strategies Tested 100 Times : https://www.youtube.com/playlist?list=PLuBdu9GKAoP4shAZd6QnM5BJUy1-IcnyD
Trading Strategies : https://www.youtube.com/playlist?list=PLuBdu9GKAoP6MEtX7stfzTGx62M5r3F4Z
Trading Tips and Mistakes : https://www.youtube.com/playlist?list=PLuBdu9GKAoP6lPl2txSXE8AlkhiwgWU2O
Download Excel Sheet for Day Trading : https://youtu.be/fLKd7uKZOvA
Subscribe For More Videos.
Well, I tested supertrend indicator 100 times, and the results I found were pretty interesting. In this video, you will learn about the supertrend trading strategy, it's real win rate, and some disadvantages I found after testing it 100 times. But first of all, if you haven't watched my ATR indicator video, maybe considered watching it before this video, since Supertrend indicator relies on the ATR values to calculate its values. And maybe checkout other videos where i tested other trading indicators 100 times to find their real winrates. You can watch them on the official Trading Rush Website.
If you are new to trading, and have never heard of this indicator before, here's how the popular Super Trend Indicator looks like. Now, on some trading platforms, super trend indicator can look a little bit different. But the basic indicator will look something like this.
A simple line that changes its color now and then. These colors are usually red and green.
The supertrend indicator is very similar to a moving average. and just like a moving average plotted on a chart, supertrend indicator will also give crossovers time to time.
When the Supertrend line is below the price, the color of the indicator will turn green. Similarly, When the Supertrend indicator is above the price, the color of the indicator will turn red.
But what do these changing colors mean? Well, as the name of the indicator suggests, the Supertrend indicator is trying to show the current Price Trend. It is trying to show the direction of the trend. When the supertrend indicator is green in color, and is below the price, the price is considered to be in an uptrend.
Similarly, if the supertrend indicator is above the price, and is red in color, there is a downtrend going on.
Now to keep it simple, that's all supertrend really is. An indicator to find the direction of the trend. But people have figured out a way to use it as an entry signal generator. That's right. The simple supertrend entry strategy goes something like this.
You buy, when the supertrend indicator flips below the price, and the color of the indicator changes to green. Set your stoploss, at or below the supertrend indicator.
And you sell, when the supertrend indicator flips above the price, and the color of the supertrend changes to red. Set the stoploss, at or above the supertrend line.
Now once you have entered the trade, how can you exit using the same indicator? Well, if you are not the trader that uses a fixed stop loss and profit target, you can use the supertrend line to trail your stop loss.
When the supertrend indicator turns green and flips below the price, you can enter the long trade, and trail the stoploss just below the supertrend line. The line will eventually flip over the price, and then you can completely close your long position.
If you have entered a short position when the supertrend flipped to red color, you can trail your stop loss using the supertrend line.
Thanks For Watching!
Subscribe for More Videos!
Like and Share the Video to see More Stock Market Intraday Trading Strategy and Forex Day Trading Strategies
Видео Supertrend Indicator Tested 100 Times so you don't have to... - Forex Day Trading канала TRADING RUSH
Показать
Комментарии отсутствуют
Информация о видео
Другие видео канала
 Most Profitable Supertrend Strategy for Daytrading (Full Supertrend Indicator Tutorial)
 How I got 70% Win Rate in Trading with this... Trading Strategy - Forex Day Trading
 Review: “The Most Accurate Buy Sell Signal Indicator - 100% Profitable Trading Strategy"
 I tested RSI + SUPERTREND Trading Strategy 100 TIMES... so you don't have to - Forex Day Trading
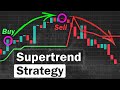 BEST Supertrend Strategy for Daytrading Forex (Supertrend Tutorial)
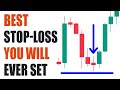 ATR Trading Strategy - The Best Stop Loss Indicator Out There ! - Forex Day Trading
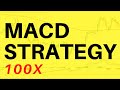 I risked MACD Trading Strategy 100 TIMES Here’s What Happened... - Forex Day Trading
 86% Win Rate Highly Profitable Secret Strategy | RSI + Secret Indicator
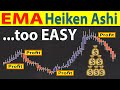 🔴 EMA-Heiken Ashi | This is The Trading Strategy The Top 5% Use (and it makes trading way too EASY!)
 HIGHEST PROFIT Triple Supertrend Trading Strategy Proven 100 Trade Results
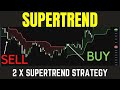 Supertrend Indicator: Learn How Simple It Is To Use
 You Have NEVER Seen This - Pivot SuperTrend!
 A Powerful Supertrend Indicator Trading Strategy (Explained)
 Best Supertrend Indicator Strategy (For Beginners)
 FASTEST & Most AGGRESSIVE Best Indicators For ZERO Lag Scalping Trading With Price Action Strategy
 138% Profit - 2% Per Trade - Complete Strategy
 Heikin Ashi - Best For Beginner Day Traders ? - Forex Day Trading
 Trading Strategy With Best Tradingview Indicators - UNKNOWN + MACD + RSI + SMA 4H 1H 1D Time Frame
![BEST Tradingview Buy Sell Indicator [SECRET BUY SELL INDICATOR TRADINGVIEW]](https://i.ytimg.com/vi/IhBuFMxQdMg/default.jpg) BEST Tradingview Buy Sell Indicator [SECRET BUY SELL INDICATOR TRADINGVIEW]
BEST Tradingview Buy Sell Indicator [SECRET BUY SELL INDICATOR TRADINGVIEW]