- Популярные видео
- Авто
- Видео-блоги
- ДТП, аварии
- Для маленьких
- Еда, напитки
- Животные
- Закон и право
- Знаменитости
- Игры
- Искусство
- Комедии
- Красота, мода
- Кулинария, рецепты
- Люди
- Мото
- Музыка
- Мультфильмы
- Наука, технологии
- Новости
- Образование
- Политика
- Праздники
- Приколы
- Природа
- Происшествия
- Путешествия
- Развлечения
- Ржач
- Семья
- Сериалы
- Спорт
- Стиль жизни
- ТВ передачи
- Танцы
- Технологии
- Товары
- Ужасы
- Фильмы
- Шоу-бизнес
- Юмор
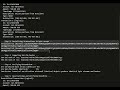
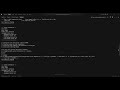
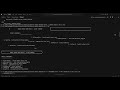
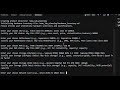
Setting Breakpoints and Viewing Call Stacks in WinDbg
Understanding the Core Problem
When your Windows service deadlocks at 3 AM and all you have is a crash dump, knowing WinDbg's breakpoint mechanics and stack unwinding isn't optional—it's the difference between finding the bug and guessing. Most tutorials show you bp kernel32!CreateFileW, but they don't explain why that breakpoint sometimes fires on the wrong instruction, or why your call stack shows garbage in optimized builds.
I once debugged a driver that corrupted memory only under heavy load. Setting a breakpoint on the suspected function didn't help—the corruption happened before my breakpoint hit. The problem? I used a software breakpoint (bp) which patches code with 0xCC (INT 3). In a race condition, another thread executed the half-written instruction before my breakpoint was fully set. This matters because Windows handles breakpoints fundamentally differently than POSIX debuggers.
Видео Setting Breakpoints and Viewing Call Stacks in WinDbg канала Hands On Course Demo
Комментарии отсутствуют
Информация о видео
18 января 2026 г. 15:54:27
00:00:54
Другие видео канала