- Популярные видео
- Авто
- Видео-блоги
- ДТП, аварии
- Для маленьких
- Еда, напитки
- Животные
- Закон и право
- Знаменитости
- Игры
- Искусство
- Комедии
- Красота, мода
- Кулинария, рецепты
- Люди
- Мото
- Музыка
- Мультфильмы
- Наука, технологии
- Новости
- Образование
- Политика
- Праздники
- Приколы
- Природа
- Происшествия
- Путешествия
- Развлечения
- Ржач
- Семья
- Сериалы
- Спорт
- Стиль жизни
- ТВ передачи
- Танцы
- Технологии
- Товары
- Ужасы
- Фильмы
- Шоу-бизнес
- Юмор
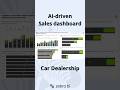
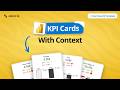
Create Self-Service BI Power BI Dashboards with Zebra BI (+ Free PBIX) | 12 of 12 Days to Clarity
📊 Unlock self-service reporting in Power BI with Zebra BI. Build dynamic dashboards, compare forecasts, and add insights with no deep Power BI knowledge required. Empower your team with clear, decision-ready reports.
Unwrap your Day 12 gift. Visit 👉 https://bit.ly/3MJViYf
to grab the free Power BI template (PBIX) and explore all 12 Days to Clarity resources.
Start Your Zebra BI Free Trial: https://bit.ly/4pSii6g
👉 Want inspiration for dashboard design? Check out The BEST Power BI Dashboards You’ll LOVE in 2025 where we show proven layouts and visualization frameworks you can apply to your reports:
https://youtu.be/XmaEyD2poQE
💡 Simplify your reporting with IBCS-compliant, automated visuals. Download Zebra BI for Power BI today and build clear, actionable dashboards in minutes — no coding, no complexity. Start here: https://bit.ly/4s4gM2f
⚡🚀⏱️Meet Zebra AI, your AI-powered data assistant. Clean and prepare messy Excel or CSV files instantly, generate insights automatically, and let the visuals do the heavy lifting — from dynamic comments to responsive layouts. Try it now: https://bit.ly/3KSD3iU
---------------------------------------------------------------------------------------------------------------------------------------------------------------
▶EDUCATION:
Join Zebra BI Academy for free Power BI course: https://bit.ly/3MBrygi
---------------------------------------------------------------------------------------------------------------------------------------------------------------
▶RESOURCES 💵📊📈📉💡
Explore all 12 Days to Clarity resources: https://bit.ly/3MJViYf
Free Webinars: https://zebrabi.com/resources/?_resource_type=webinar#filters
Guide: Optimize Power BI report performance: https://zebrabi.com/power-bi-performance-optimization/
Case Study – Helvetia: https://zebrabi.com/customer_stories/helvetia/
Knowledge Base: https://help.zebrabi.com/kb/power-bi/data-modeling/
---------------------------------------------------------------------------------------------------------------------------------------------------------------
Chapters:
00:00 Introduction to self-service reporting in Power BI
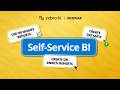
00:26 What is self-service BI and its benefits?
01:11 Creating KPIs with Zebra BI Cards
04:15 Visualizing trends with Zebra BI
06:27 Data breakdowns with Zebra BI
07:25 Using Zebra BI’s Top N function for insights
08:57 Adding comments to enhance data explanations
09:41 Conclusion: Self-service BI with Zebra BI in Power BI
---------------------------------------------------------------------------------------------------------------------------------------------------------------
▶More Content 🍿🎥📺🎞️🎬
The BEST Power BI Dashboards You’ll LOVE in 2025 (Proven Framework): https://youtu.be/XmaEyD2poQE
Zebra BI Webinars Playlist: https://www.youtube.com/playlist?list=PLBTvRNTcMStU-sv2I2vKog3RgUvrxQKB1
Zebra BI Channel: https://www.youtube.com/@ZebraBI
---------------------------------------------------------------------------------------------------------------------------------------------------------------
▶EXTRA
Follow us on socials: Twitter: https://twitter.com/zebrabi | Facebook: https://www.facebook.com/zebra.bi/ | LinkedIn: https://www.linkedin.com/company/5051039
Website: https://www.zebrabi.com/
Want a live demo of Zebra BI? Sign up: https://zebrabi.com/live-demo
---------------------------------------------------------------------------------------------------------------------------------------------------------------
▶Business inquiries: info@zebrabi.com
#PowerBI #selfservicebi #ZebraBI
Видео Create Self-Service BI Power BI Dashboards with Zebra BI (+ Free PBIX) | 12 of 12 Days to Clarity канала Zebra BI
Unwrap your Day 12 gift. Visit 👉 https://bit.ly/3MJViYf
to grab the free Power BI template (PBIX) and explore all 12 Days to Clarity resources.
Start Your Zebra BI Free Trial: https://bit.ly/4pSii6g
👉 Want inspiration for dashboard design? Check out The BEST Power BI Dashboards You’ll LOVE in 2025 where we show proven layouts and visualization frameworks you can apply to your reports:
https://youtu.be/XmaEyD2poQE
💡 Simplify your reporting with IBCS-compliant, automated visuals. Download Zebra BI for Power BI today and build clear, actionable dashboards in minutes — no coding, no complexity. Start here: https://bit.ly/4s4gM2f
⚡🚀⏱️Meet Zebra AI, your AI-powered data assistant. Clean and prepare messy Excel or CSV files instantly, generate insights automatically, and let the visuals do the heavy lifting — from dynamic comments to responsive layouts. Try it now: https://bit.ly/3KSD3iU
---------------------------------------------------------------------------------------------------------------------------------------------------------------
▶EDUCATION:
Join Zebra BI Academy for free Power BI course: https://bit.ly/3MBrygi
---------------------------------------------------------------------------------------------------------------------------------------------------------------
▶RESOURCES 💵📊📈📉💡
Explore all 12 Days to Clarity resources: https://bit.ly/3MJViYf
Free Webinars: https://zebrabi.com/resources/?_resource_type=webinar#filters
Guide: Optimize Power BI report performance: https://zebrabi.com/power-bi-performance-optimization/
Case Study – Helvetia: https://zebrabi.com/customer_stories/helvetia/
Knowledge Base: https://help.zebrabi.com/kb/power-bi/data-modeling/
---------------------------------------------------------------------------------------------------------------------------------------------------------------
Chapters:
00:00 Introduction to self-service reporting in Power BI
00:26 What is self-service BI and its benefits?
01:11 Creating KPIs with Zebra BI Cards
04:15 Visualizing trends with Zebra BI
06:27 Data breakdowns with Zebra BI
07:25 Using Zebra BI’s Top N function for insights
08:57 Adding comments to enhance data explanations
09:41 Conclusion: Self-service BI with Zebra BI in Power BI
---------------------------------------------------------------------------------------------------------------------------------------------------------------
▶More Content 🍿🎥📺🎞️🎬
The BEST Power BI Dashboards You’ll LOVE in 2025 (Proven Framework): https://youtu.be/XmaEyD2poQE
Zebra BI Webinars Playlist: https://www.youtube.com/playlist?list=PLBTvRNTcMStU-sv2I2vKog3RgUvrxQKB1
Zebra BI Channel: https://www.youtube.com/@ZebraBI
---------------------------------------------------------------------------------------------------------------------------------------------------------------
▶EXTRA
Follow us on socials: Twitter: https://twitter.com/zebrabi | Facebook: https://www.facebook.com/zebra.bi/ | LinkedIn: https://www.linkedin.com/company/5051039
Website: https://www.zebrabi.com/
Want a live demo of Zebra BI? Sign up: https://zebrabi.com/live-demo
---------------------------------------------------------------------------------------------------------------------------------------------------------------
▶Business inquiries: info@zebrabi.com
#PowerBI #selfservicebi #ZebraBI
Видео Create Self-Service BI Power BI Dashboards with Zebra BI (+ Free PBIX) | 12 of 12 Days to Clarity канала Zebra BI
#PowerBI #SelfServiceBI #ZebraBI #DataExploration #FinancialReporting #PowerBIDashboards #BusinessIntelligence #DynamicReports #Forecasting #FinancialDashboard #DataClarity #DecisionMaking #BusinessReporting #DataDriven #DataVisualization #Analytics #PerformanceReporting #FinancialForecasting #BusinessIntelligenceTools #InteractiveReports #PowerBICommunity #AnalyticsTools #DynamicTitles #DataInsights
Комментарии отсутствуют
Информация о видео
23 декабря 2025 г. 13:00:27
00:11:16
Другие видео канала


![7 Worst Mistakes in Power BI And How To Avoid Them! ⚡ [Meetup with NZ User Group]](https://i.ytimg.com/vi/yfBjx8LPd88/default.jpg)