- Популярные видео
- Авто
- Видео-блоги
- ДТП, аварии
- Для маленьких
- Еда, напитки
- Животные
- Закон и право
- Знаменитости
- Игры
- Искусство
- Комедии
- Красота, мода
- Кулинария, рецепты
- Люди
- Мото
- Музыка
- Мультфильмы
- Наука, технологии
- Новости
- Образование
- Политика
- Праздники
- Приколы
- Природа
- Происшествия
- Путешествия
- Развлечения
- Ржач
- Семья
- Сериалы
- Спорт
- Стиль жизни
- ТВ передачи
- Танцы
- Технологии
- Товары
- Ужасы
- Фильмы
- Шоу-бизнес
- Юмор
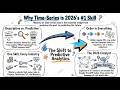
Every messy data stream hides three perfect patterns. Here is how to find them.
Before any machine learning model or forecasting algorithm can do its job, one step has to happen first. You have to separate what is mathematically real from what is random noise.
That process is called decomposition, and it is the mandatory foundation of every serious time series workflow.
In this video we break it down completely:
→ The core equation: every observed series is just trend plus seasonality plus residuals
→ How to read the shape of your raw data before writing a single line of code
→ When to use an additive model versus a multiplicative model, and why picking the wrong one poisons your residuals
→ How to run classical decomposition in Python using statsmodels in three lines
→ Why classical models produce leakage when real-world behaviour shifts over time
→ How STL decomposition solves that problem and why it is the current industry standard
By the end, you will be able to take any chaotic data stream, whether it is supply chain volume, hospital capacity, or electricity demand, and extract the three clean structural signals hiding inside it.
The full Python script is in the repo. Download it and run this on your own data right now.
Code repo: https://github.com/NiketGirdhar22/time-series
Video 1 (start here if you haven't): Why time series is the most important data skill in 2026
Subscribe for Video 3 dropping Sunday.
References
Forecasting: Principles and Practice · Hyndman and Athanasopoulos
statsmodels STL documentation · statsmodels.org
Cleveland et al. (1990) · STL original paper Transparency note
This video was produced using AI-assisted tools for script structuring, narration, and visuals. The ideas, editorial direction, and learning framework are our own. AI was used as a production layer, not as the thinking behind it.
We believe good education is about clarity of thought, not the tool used to express it. Questions about our process are welcome in the comments.
#timeseries #datascience #python #forecasting #machinelearning #timeseriesanalysis #statsmodels #dataanalysis #STL #decomposition #learnpython
Видео Every messy data stream hides three perfect patterns. Here is how to find them. канала grab ATTENTION
Комментарии отсутствуют
Информация о видео
29 апреля 2026 г. 17:59:28
00:05:09
Другие видео канала