- Популярные видео
- Авто
- Видео-блоги
- ДТП, аварии
- Для маленьких
- Еда, напитки
- Животные
- Закон и право
- Знаменитости
- Игры
- Искусство
- Комедии
- Красота, мода
- Кулинария, рецепты
- Люди
- Мото
- Музыка
- Мультфильмы
- Наука, технологии
- Новости
- Образование
- Политика
- Праздники
- Приколы
- Природа
- Происшествия
- Путешествия
- Развлечения
- Ржач
- Семья
- Сериалы
- Спорт
- Стиль жизни
- ТВ передачи
- Танцы
- Технологии
- Товары
- Ужасы
- Фильмы
- Шоу-бизнес
- Юмор
How to plot a graph using Origin Software
Please subscribe my channel.
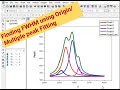
This video is on uploading data and drawing Graphs using Origin. Just Drag and drop the original data file and draw the graph. As an example, we have used an FTIR data file as a sample for drawing. The graph is formatted as per the publication requirement. It is a beginner tutorial for new research students.
Видео How to plot a graph using Origin Software канала DIGITEK KEYS
Комментарии отсутствуют
Информация о видео
22 июня 2025 г. 16:12:49
00:00:52
Другие видео канала